Aurora Forecast and Prediction for Glendale, Arizona
Did you mean: Wilton, Iowa, United States?
Kp: 0.67 | Bz: 1.79
Best Viewing Window: 3:26 AM – 6:11 AM MST (2h 45m) · peak hours typically 10:31 PM – 2:31 AM
 Best Viewing Window:
3:26 AM – 6:11 AM MST
Best Viewing Window:
3:26 AM – 6:11 AM MST Space Weather Now
Timing: Now · Signal Strength: High
Webcam
No aurora cams nearby. Center on nearest camera (1233 mi away).
Browse other webcams on Windy3-Day Forecast for Glendale, Arizona
Oct 12
Too far south - the aurora stays out of view from Glendale even during a severe (Kp 9) storm.
Global: NOAA has issued a watch for this night (see below) - moderate planetary activity, aurora across the high-latitude zone.
CME Watch: G1 (Minor) · Kp 5 expected
Best time to look up: 2:00 AM–5:00 AM MST
35% chance of elevated activity · Kp 4.33 during viewing window, up to Kp 5 depending on CME timing
Oct 13
Too far south - the aurora stays out of view from Glendale even during a severe (Kp 9) storm.
Global: Moderate planetary activity expected - aurora across the high-latitude zone, and lower with a good substorm.
Best time to look up: 8:00 PM–11:00 PM MST
35% chance of elevated activity · Kp 4 during viewing window
Oct 14
Too far south - the aurora stays out of view from Glendale even during a severe (Kp 9) storm.
Global: Moderate planetary activity expected - aurora across the high-latitude zone, and lower with a good substorm.
Best time to look up: 8:00 PM–11:00 PM MST
20% chance of elevated activity · Kp 3.33 during viewing window
Aurora Oval & Satellite & Sun
Interactive Aurora Globe
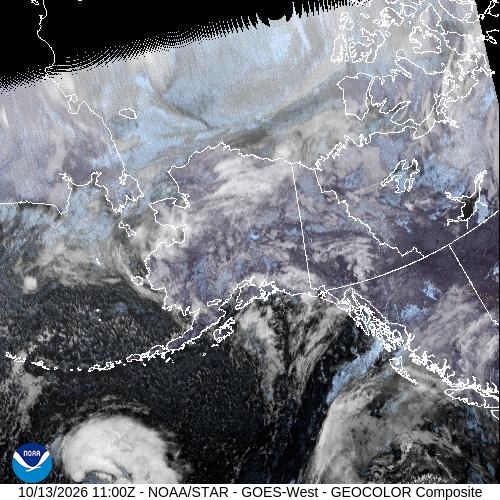
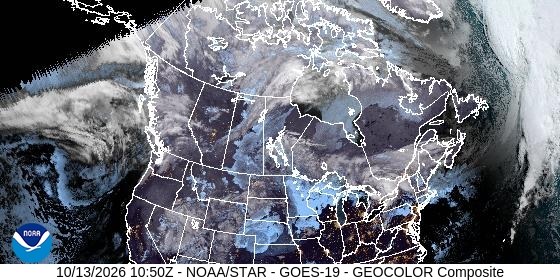
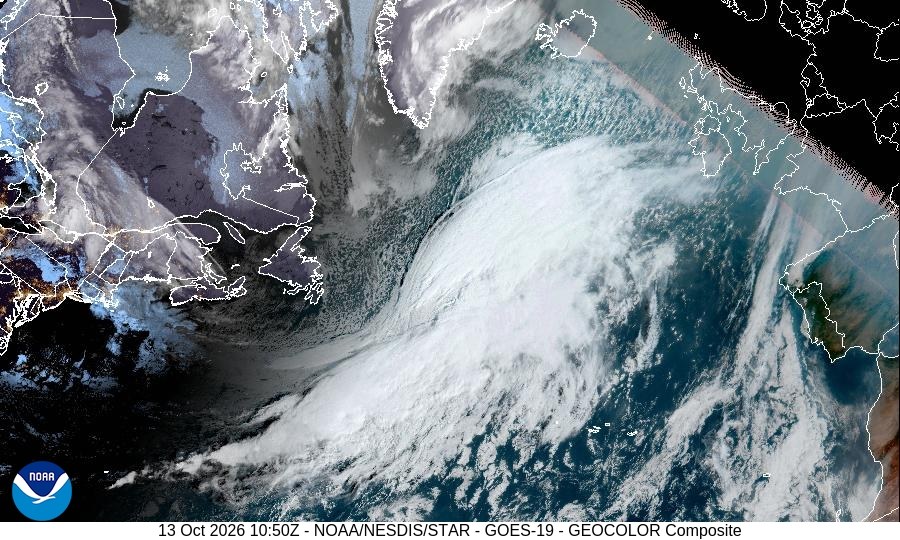
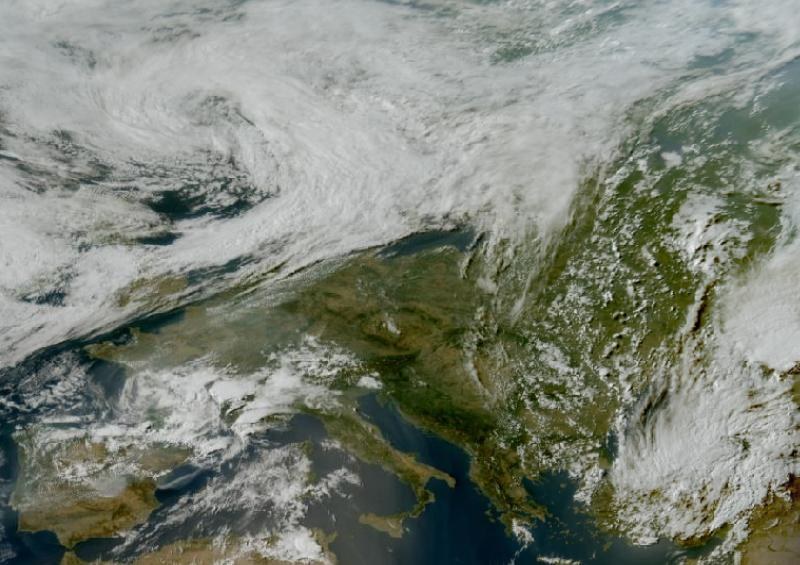
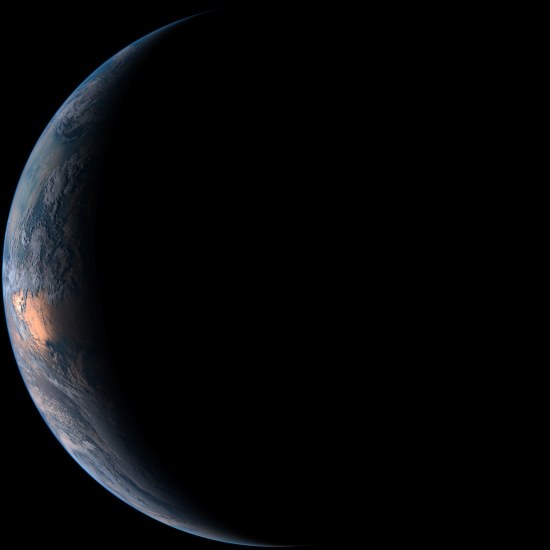
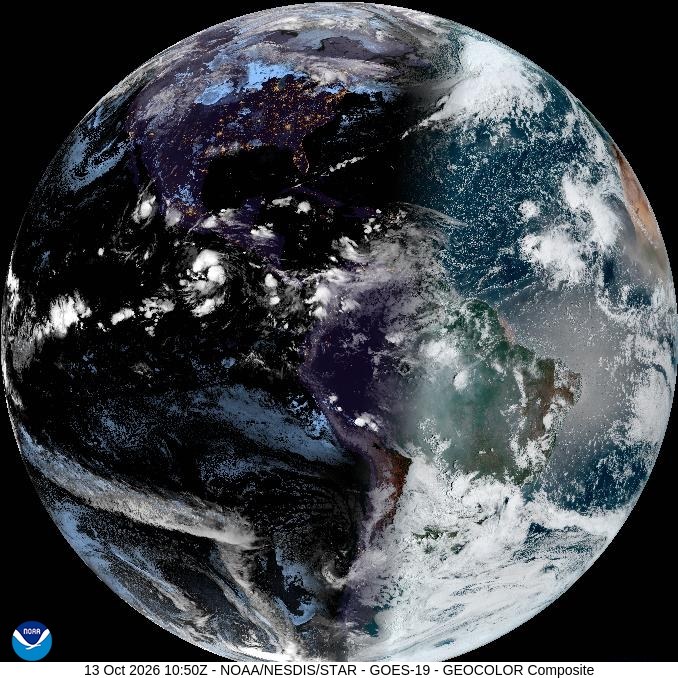
Satellite View

Sunspots
Current sunspot number: 93

Coronal Mass Ejections
Aurora Photography by Todd Salat
Original prints from Todd Salat's collection.

Treasure Trove
Seward, AK · 2023

Tree of Life
Arctic Circle, Alaska · 2025

Valley of Light
Brooks Range, Alaska · 1999
Solar Wind & IMF (GSM)
- Bt
- 9.4 nT
- Bx
- 3.5 nT
- By
- -8.6 nT
- Bz
- 1.79 nT
- Clock Angle θ
- 7.8°
- Cone Angle φ
- 292.1°
- Speed
- 488 km/s
- Density
- 9.7 p/cc
IMF Detail (GSE) & Source
- Bx
- 3.5 nT
- By
- -8 nT
- Bz
- -3.4 nT
- θ Angle
- -21.2°
- φ Angle
- 293.6°
- Satellite
- SOLAR-1
- Data Quality
- Good
- Reading Time
- Oct 13, 3:20 AM MST
Geomagnetic Indices
- Kp (now)
- 0.67
- Dst
- -12 nT
- HPI
- 12 GW
- Sunspot Number
- 93
Aurora Model
- Ovation Value
- 0
- Ovation Label
- None
- Model Data Time
- Oct 13, 4:10 AM MST
- Ovation Data
- Live
Scores & Ratings
- Aurora Visibility
- 0 · Poor
- Aurora Visibility (w/ Moon)
- 0 · Poor
- Prediction Score
- 0 · Little to None
Sky & Location
- Cloud Cover
- 100% · Overcast
- Clouds, Next Dark Window
- 100% · Overcast · ×0.05
- Aurora Visibility Tonight
- 0 · Poor (Outlook Tonight 0 × cloud 0.05)
- Solar Elevation
- -39.1° · Dark Night
- Moon Phase
- Waxing Crescent
- Moon Illumination
- 5%
- Moon Altitude
- -72.2° · Below Horizon
- Latitude
- 33.53865
- Longitude
- -112.18599
- Geomagnetic Latitude
- 40.5°
- Horizon Threshold
- Never
- Overhead Threshold
- Never
Prediction Model Inputs
- Bz Persistence (60min)
- -0 nT
- Newell Coupling
- 5012
- Latitude Gate
- 0.00 now · 0.00 tonight
- Dynamic Pressure
- 3.9 nPa
- Storm Watch (CME)
- ~0h · G1 (Minor)
- Watch Predicted Kp
- 5
Timing & Signal Strength
- Timing
- Now
- Signal Strength
- High
- L1 Delay
- ~51 min
- Magnetic Midnight
- 12:31 AM (peak hours 10:31 PM – 2:31 AM)
- Best Viewing Window
- 3:26 AM – 6:11 AM MST (2h 45m)
3-Day Kp Forecast
| MST | Oct 13 | Oct 14 | Oct 15 |
|---|---|---|---|
| 5:00 PM–8:00 PM | 4 | 3.67 | 2.67 |
| 8:00 PM–11:00 PM | 4.67 | 4 | 3.33 |
| 11:00 PM–2:00 AM | 5 | 2.67 | 3 |
| 2:00 AM–5:00 AM | 4.33 | 3.67 | 2.33 |
| 5:00 AM–8:00 AM | 4 | 3.67 | 1.67 |
| 8:00 AM–11:00 AM | 3.67 | 3.67 | 1 |
| 11:00 AM–2:00 PM | 3.33 | 3.33 | 1.33 |
| 2:00 PM–5:00 PM | 2.67 | 2.67 | 2.33 |
| Max | 5 | 4 | 3.33 |
| Ap Index | 28 | 20 | 10 |
Storm Probability
| Level | Oct 13 | Oct 14 | Oct 15 |
|---|---|---|---|
| Active | 35% | 35% | 20% |
| Minor storm | 35% | 25% | 5% |
| Moderate storm | 15% | 10% | 1% |
| Strong-Extreme storm | 5% | 1% | 1% |
Planetary K-index
Interplanetary Magnetic Field Bz0.8 nT now
Southward (negative) Bz favors aurora. Observed data only, no forecast product exists for Bz.
Total IMF Field Bt9.7 nT now
Total interplanetary magnetic field strength - the ceiling on how negative Bz can go. A rising Bt alongside a still-fluctuating Bz often leads a stronger southward turn. Observed data only, no forecast product exists for Bt.
Global Storm Trend24 global now
Global (hemisphere-wide, not this city) prediction score over the last 24 hours, logged every 5 minutes - may differ from the Prediction ring above, which is specific to this location and time of night. Red above 70, yellow 50-70, teal below 50 - same thresholds used everywhere else on this page. Dashed line is the overall trend.
Dst History-12 nT now
Kyoto Dst geomagnetic storm index over the last 24 hours. Negative = ring-current energy stored = an active storm, not just predicted. Red below −50nT, yellow −20 to −50nT, teal above −20nT.
Solar Wind Speed & Pressure
Each line is scaled independently to its own 24h range (different units) - watch the shape, not a shared axis. A rising speed line or a pressure spike can signal an incoming stream or shock before Bz/Dst move.
Nerd Mode: See what’s really driving the score. Live solar wind, Bz, Kp, Dst, CME timing, and more. Data comes from NOAA SWPC and the Kyoto WDC, with a few metrics calculated here from the raw data. Live data refreshes every minute; trend charts every five.
Aurora Forecasts for Nearby Cities
Checking conditions somewhere else tonight? These are the closest cities with their own northern lights prediction.
- Phoenix 9 mi
- Scottsdale 17 mi
- Mesa 22 mi
- Chandler 26 mi
- Gilbert 26 mi
- Tucson 117 mi
- Henderson 235 mi
- Las Vegas 247 mi
Related Northern Lights Pages

Browse all prediction cities →


