Aurora Outlook and Prediction for Queensburgh, KwaZulu-Natal, South Africa
Kp: 1 | Bz: -4.21
Best Viewing Window: 6:06 PM – 5:51 AM SAST (11h 45m)
 Best Viewing Window:
6:06 PM – 5:51 AM SAST
Best Viewing Window:
6:06 PM – 5:51 AM SAST Space Weather Now
Timing: Tonight · Confidence: Low
Webcam
No aurora cams nearby. Center on nearest camera (7687 km away).
Browse other webcams on Windy3-Day Forecast for Queensburgh, KwaZulu-Natal, South Africa
Aug 31
QuietLow chance of aurora - geomagnetic activity is expected to stay quiet.
Best time to look up: 8:00 PM–11:00 PM SAST
40% chance of elevated activity · Kp 2 during viewing window
Sep 01
QuietLow chance of aurora - geomagnetic activity is expected to stay quiet.
Best time to look up: 11:00 PM–2:00 AM SAST
10% chance of elevated activity · Kp 1.67 during viewing window
Sep 02
QuietLow chance of aurora - geomagnetic activity is expected to stay quiet.
Best time to look up: 11:00 PM–2:00 AM SAST
10% chance of elevated activity · Kp 1.67 during viewing window
Aurora Oval & Satellite & Sun
Interactive Aurora Globe


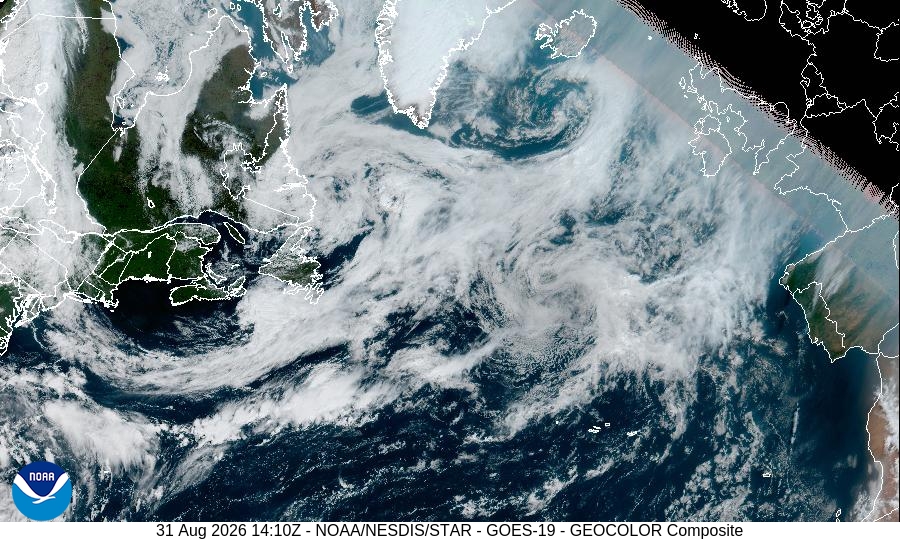
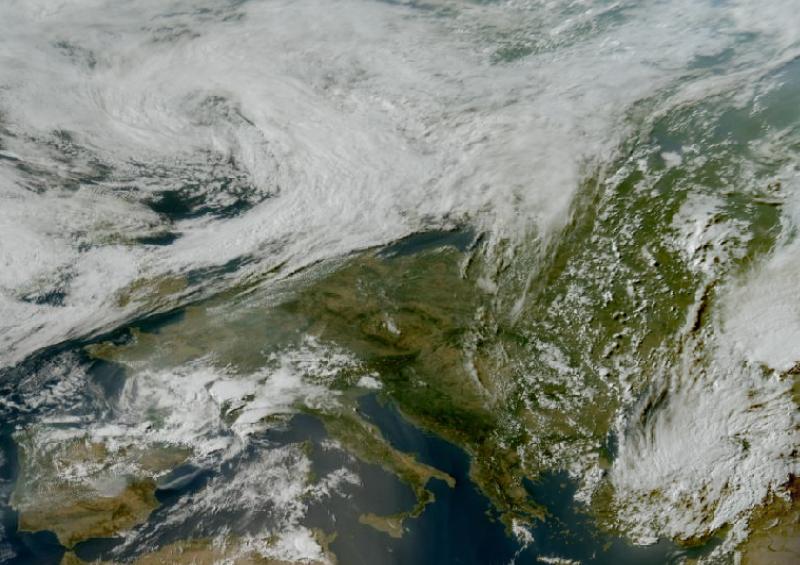

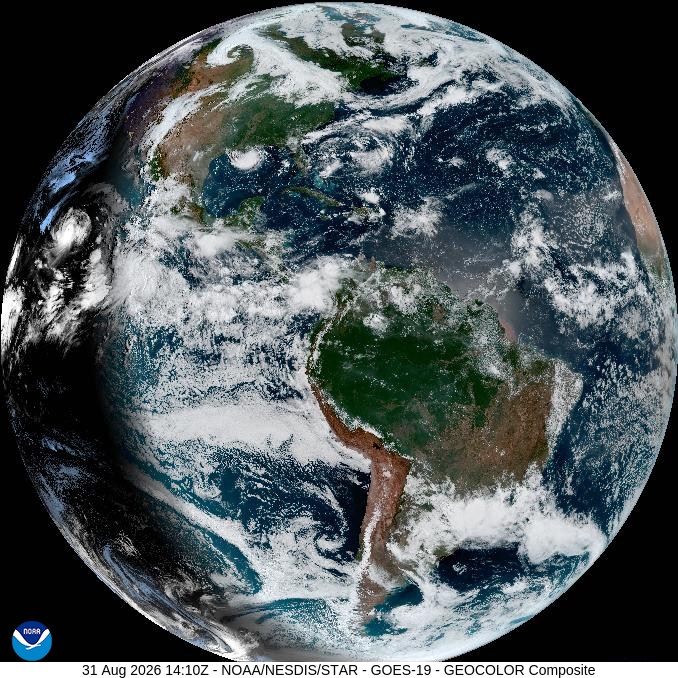
Satellite View

Sunspots
Current sunspot number: 74

Coronal Mass Ejections
Solar Wind & IMF (GSM)
- Bt
- 5 nT
- Bx
- -2 nT
- By
- -1.6 nT
- Bz
- -4.21 nT
- Clock Angle θ
- -58.8°
- Cone Angle φ
- 219°
- Speed
- 423 km/s
- Density
- 3.2 p/cc
IMF Detail (GSE) & Source
- Bx
- -2 nT
- By
- 0.7 nT
- Bz
- -4.4 nT
- θ Angle
- -62.8°
- φ Angle
- 156.9°
- Satellite
- SOLAR-1
- Data Quality
- Good
- Reading Time
- Aug 31, 3:38 PM SAST
Geomagnetic Indices
- Kp (now)
- 1
- Dst
- -12 nT
- HPI
- 5 GW
- Sunspot Number
- 74
Aurora Model
- Ovation Value
- 0
- Ovation Label
- None
- Model Data Time
- Aug 31, 4:38 PM SAST
- Ovation Data
- Live
Scores & Ratings
- Aurora Visibility
- 0 · Poor
- Aurora Visibility (w/ Moon)
- 0 · Poor
- Prediction Score
- 16 · Little to None
Sky & Location
- Cloud Cover
- 97% · Overcast
- Solar Elevation
- 22.9° · Daytime
- Moon Phase
- Waning Gibbous
- Moon Illumination
- 87%
- Moon Altitude
- -62.5° · Below Horizon
- Latitude
- -29.87769
- Longitude
- 30.90643
- Geomagnetic Latitude
- -31.6°
- Horizon Threshold
- Never
- Overhead Threshold
- Never
Prediction Model Inputs
- Bz Persistence (60min)
- -1.5 nT
- Newell Coupling
- 8883
- Dynamic Pressure
- 1 nPa
- Storm Watch (CME)
- —
- Watch Predicted Kp
- —
Timing & Confidence
- Timing
- Tonight
- Confidence
- Low
- L1 Delay
- ~3546 min
- Best Viewing Window
- 6:06 PM – 5:51 AM SAST (11h 45m)
3-Day Kp Forecast
| SAST | Aug 31 | Sep 01 | Sep 02 |
|---|---|---|---|
| 2:00 AM–5:00 AM | 4 | 1.67 | 1.67 |
| 5:00 AM–8:00 AM | 3.33 | 1.33 | 1.67 |
| 8:00 AM–11:00 AM | 3 | 1.67 | 1.33 |
| 11:00 AM–2:00 PM | 2 | 1.33 | 1.33 |
| 2:00 PM–5:00 PM | 2 | 1.33 | 1.33 |
| 5:00 PM–8:00 PM | 1 | 1.33 | 1.33 |
| 8:00 PM–11:00 PM | 2 | 1.33 | 1.33 |
| 11:00 PM–2:00 AM | 2 | 1.67 | 1.67 |
| Max | 4 | 1.67 | 1.67 |
| Ap Index | 12 | 5 | 5 |
Storm Probability
| Level | Aug 31 | Sep 01 | Sep 02 |
|---|---|---|---|
| Active | 40% | 10% | 10% |
| Minor storm | 10% | 1% | 1% |
| Moderate storm | 1% | 1% | 1% |
| Strong-Extreme storm | 1% | 1% | 1% |
Planetary K-index
Interplanetary Magnetic Field Bz-4.2 nT now
Southward (negative) Bz favors aurora. Observed data only, no forecast product exists for Bz.
Total IMF Field Bt5 nT now
Total interplanetary magnetic field strength - the ceiling on how negative Bz can go. A rising Bt alongside a still-fluctuating Bz often leads a stronger southward turn. Observed data only, no forecast product exists for Bt.
Storm Trend20 now
Prediction score (0-100) over the last 24 hours, logged every 5 minutes. Red above 70, yellow 50-70, teal below 50 - same thresholds used everywhere else on this page. Dashed line is the overall trend.
Dst History-12 nT now
Kyoto Dst geomagnetic storm index over the last 24 hours. Negative = ring-current energy stored = an active storm, not just predicted. Red below −50nT, yellow −20 to −50nT, teal above −20nT.
Solar Wind Speed & Pressure
Each line is scaled independently to its own 24h range (different units) - watch the shape, not a shared axis. A rising speed line or a pressure spike can signal an incoming stream or shock before Bz/Dst move.
Nerd Mode: See what’s really driving the score. Live solar wind, Bz, Kp, Dst, CME timing, and more. Data comes from NOAA SWPC and the Kyoto WDC, with a few metrics calculated here from the raw data. Live data refreshes every minute; trend charts every five.
Related Northern Lights Pages

Browse all prediction cities →
